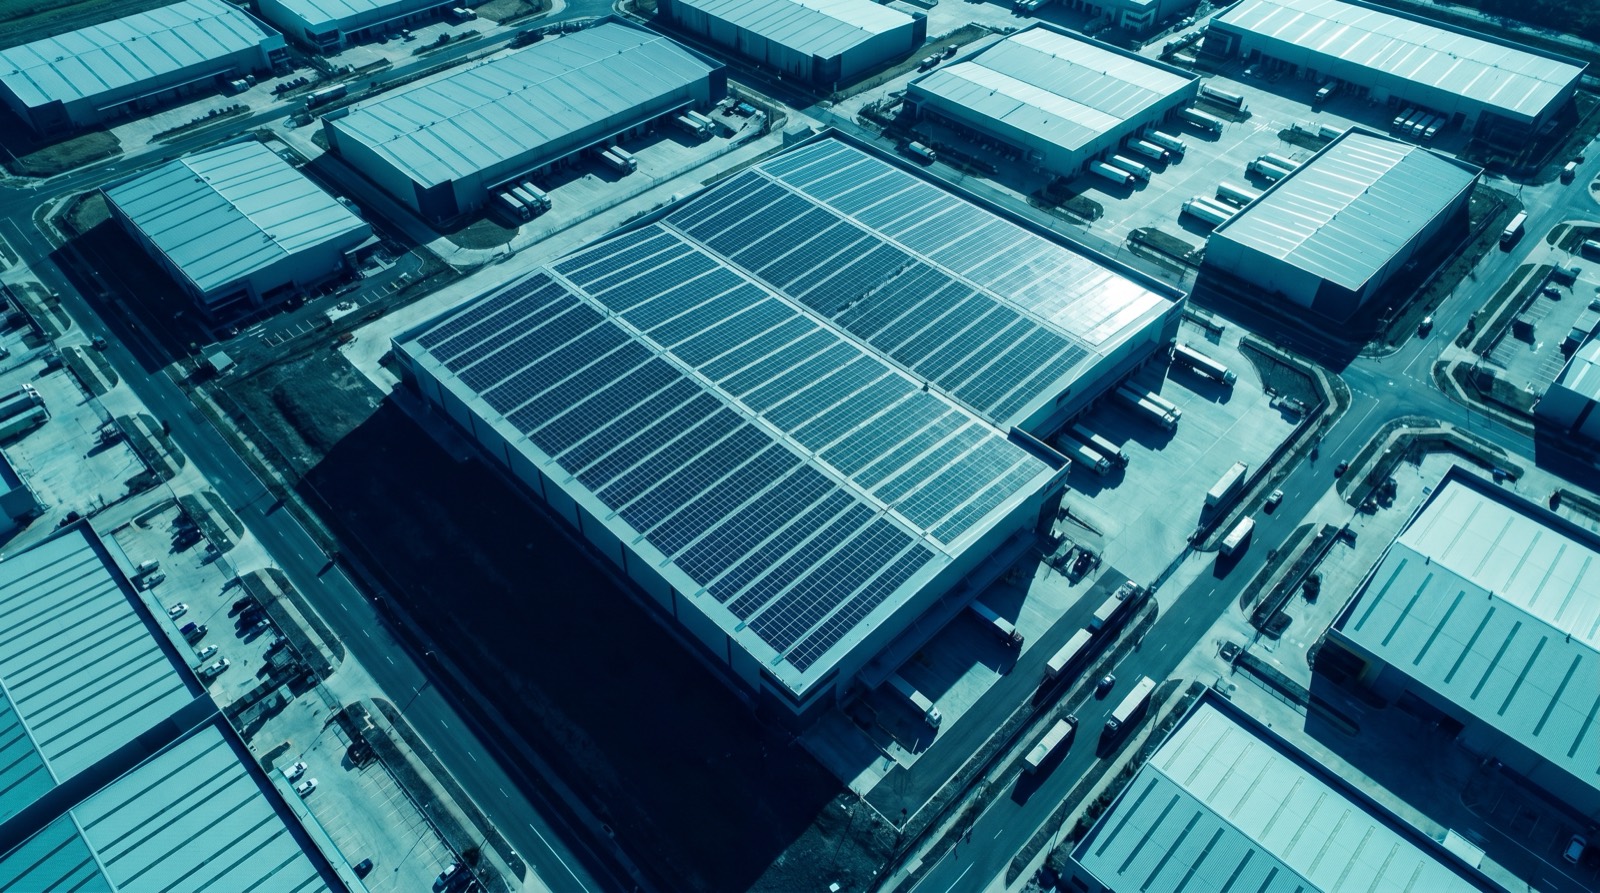
Commercial and industrial sites present the strongest solar economics in the market: large daytime loads, substantial roof or land area, and tariffs that combine volumetric energy charges with punishing demand charges. OmniYield engineers C&I systems as infrastructure investments, building a defensible financial case from metered data and delivering performance that stands up to lender and CFO scrutiny. Our designs routinely achieve an LCOE below five cents per kilowatt-hour—a fraction of the blended commercial grid rate.
Tariff analysis and demand-charge reduction
For many C&I customers, demand charges represent 30–50% of the electricity bill, billed on peak kW or kVA rather than total energy. Solar alone reduces these charges only when generation reliably coincides with the demand interval, so we analyze your demand timestamps against the solar generation curve. Where peaks fall outside solar hours, we model storage or load-shifting to shave the billed maximum. This dual focus—reducing both volumetric energy and coincident demand—is where the largest savings are captured and where naive designs leave money on the table.
System design and structural integration
C&I arrays must integrate with the building and the site without compromising either. We assess roof structural capacity, membrane condition and remaining service life, wind and point-load engineering, and fire-setback requirements before finalizing layout. For larger loads we evaluate three-phase inverter topologies, central versus string architectures, and medium-voltage interconnection. Ground-mount and carport structures are modeled where roof area is insufficient, adding shading and EV-charging value alongside generation.
Every commercial proposal is built on engineering targets we contractually stand behind:
- Performance ratio guarantee of 0.78–0.83 backed by monitored data and a production warranty
- DC/AC ratio of 1.2–1.4 to flatten the generation curve against commercial demand windows
- Demand-charge reduction modeled at the interval level, not annual averages
- Sub-5c/kWh LCOE on well-sited rooftops over a 25-year asset life
- String-level monitoring with automated fault detection and performance alerting
Financing, incentives, and emissions
We structure projects to match your capital strategy, modeling outright purchase, operating lease, and power-purchase-agreement (PPA) scenarios side by side. Each is presented with after-tax IRR, NPV, and payback, incorporating large-scale generation certificates (LGCs) or equivalent renewable energy certificates (RECs) where eligible. For most well-sited commercial projects, financed IRR lands in the 18–24% range with payback inside five years, making solar one of the highest-return capital deployments available to an operating business.
Monitoring and operational assurance
A C&I asset only delivers its modeled return if it performs continuously. We deploy string-level and inverter-level monitoring with automated alerting, so soiling, shading, or hardware faults are detected as deviations from the expected generation curve rather than discovered on the next bill. Scheduled cleaning and preventive maintenance are tied to measured soiling losses, and an annual performance review reconciles actual yield against the P50 model to confirm the asset is meeting its underwritten return and Scope 2 reduction targets.